The United States (USA) has been working and leading the charge to address air quality concerns and reduce overall emissions going into the atmosphere for over 50 years. It is important to understand where this started and how it progressed. In the 1940s, Los Angeles had rising concerns over smog that was being found in the LA Basin. Dr. Bernie Steigerwald was sent to perform site surveys of the Los Angeles, California refineries in 1958. These surveys found that many components (valves, flanges, pumps, compressors, and so on), in a facility do leak. Components that have the potential to leak might not leak at large quantities, but many small leaks added together may cause a pollution problem.
The 91st session of Congress started on January 3rd, 1969. President Lyndon Johnson was in his final few weeks of office, and President-elect Richard Nixon was on his way into office. This is one of the first times Congress has put aside funding for environmental concerns, forming the ‘Environmental Quality Improvement Act.’ In December 1970, the Environmental Protection Agency (EPA) was formed, and resources and money were invested in identifying environmental issues. More so in problems specific to fugitive emissions.
The Radian Corporation’s project used instruments to identify the presence of leaks. This was done by bagging the leak, which means isolating it by surrounding it with an apparatus that collects all leakage. Bagging was extremely expensive and time-consuming, considering most measured leaks were insignificant in volume or ‘size’. A tool was needed to identify leaks and categorize them by size to be more efficient with time.
The 91st session of Congress started on January 3rd, 1969. President Lyndon Johnson was in his final few weeks of office, and President-elect Richard Nixon was on his way into office. This is one of the first times Congress has put aside funding for environmental concerns, forming the ‘Environmental Quality Improvement Act.’ In December 1970, the Environmental Protection Agency (EPA) was formed, and resources and money were invested in identifying environmental issues. More so in problems specific to fugitive emissions.
First Fugitive Emission Projects
Two large projects were awarded. The first project went to the Radian Corporation to “Measure Atmospheric Emissions From Petroleum Refineries”, and the second to the Rockwell Corporation and Texas A&M University to “Measure Emissions From Oil & Gas Production.” Each project focused on measuring atmospheric emissions from two different sources.The Radian Corporation’s project used instruments to identify the presence of leaks. This was done by bagging the leak, which means isolating it by surrounding it with an apparatus that collects all leakage. Bagging was extremely expensive and time-consuming, considering most measured leaks were insignificant in volume or ‘size’. A tool was needed to identify leaks and categorize them by size to be more efficient with time.
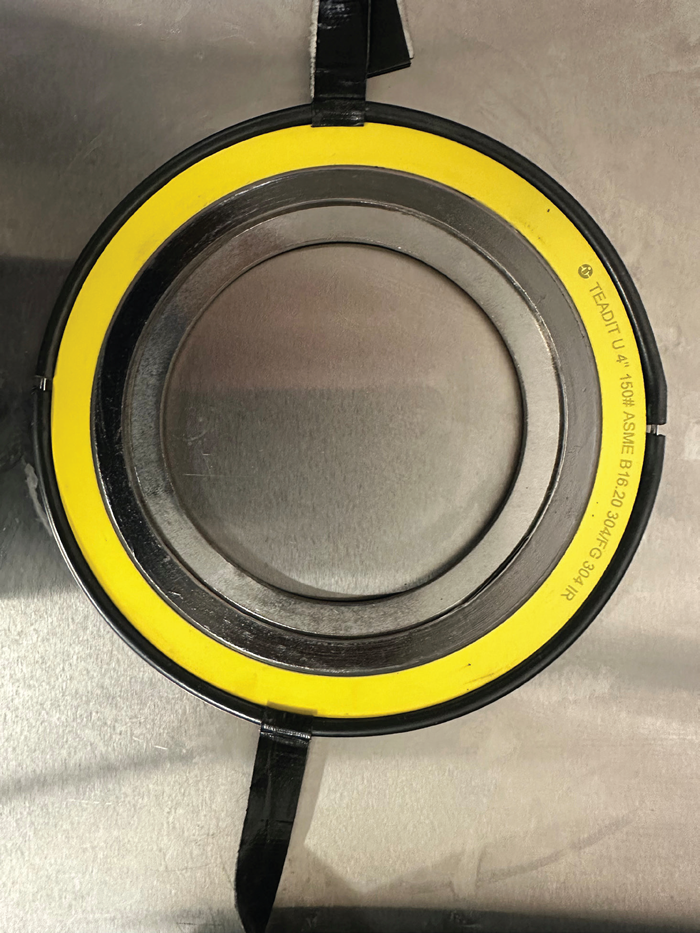 Figure 1: Spiral Wound Gasket with the O-Ring showing the bagging method.
So, a screening methodology was developed, in which a portable hydrocarbon detector was used to check all potential leaking interfaces. This screening methodology was later formalized into EPA Method 21 (M21). Typically, M21 only requires that the highest value found during the screening be recorded.
During this project, however, readings were recorded at 90°, 180°, and 270° from the maximum value found. The average was calculated from these four recorded values to get the overall observed reading.
This in turn maximized the staff’s efficiency, as they were able to determine which components would receive bagging ‘high-volume leaks’ and which would not.
The Rockwell Corporation and Texas A&M project took a different approach, using soap scoring to detect leaks. ‘Snoop,’ a liquid that is applied to the flange which bubbles when in contact with a leak, was applied to components.
Each leak detected was recorded. If no bubbles were observed that component would be considered not leaking. This methodology later became a part of M21 as a Type II test. The issue with this methodology was that you could not document the volume of the leak observed; it was just a leak or no leak.
Project Outcomes
Through these two projects, many conclusions were made.- Light liquid and gas vapor components are much more likely to leak than those in a heavy liquid service.
- The maximum screening value shows the best correlation coefficient to the emitted mass emission.
- Components, on a singular basis, have small emissions being emitted. Still, when all components are aggregated, these emissions have the potential to be quite large.
- Most components leak a very small percentage compared to very high- volume leakers.
These conclusions led to the development of the correlation equations and emission factors that were used for regulatory development. EPA was able to formalize M21 using portable analyzer screening methods. The initial analyzer specifications were designed with the Foxboro OVA-108 in mind, an analog Organic Vapor Analyzer that provided PPM results. These specifications encompassed a range of procedures, including those for analyzer evaluations, calibration, and monitoring.
Considering these efforts, the Environ- mental Protection Agency (EPA) identified a need for further initiatives, particularly within the Synthetic Organic Chemical Manufacturing Industry (SOCMI) and natural gas plants. These endeavors were geared towards addressing fugitive emissions and transpired during the early 1980s. The American Chemistry Council (ACC), previously referred to as the Chemical Manufacturing Association (CMA), funded investigations on emissions from ethylene oxide, butadiene, and phosgene facilities in the late 1980s. Lastly, the American Petroleum Institute (API) and Western States Petroleum Association (WSPA) co-funded additional refinery investigations in the early 1990s.
This gave the EPA the ability to start implementing regulations on fugitive emissions.
Regulation Implementation
These regulations were based on one of three types of standards. The preferred method became the ‘Emission Limits’ standard, as it can be mass-based (lb/hr) or concentration-based (ppm). All regulated facilities can meet this standard and it can be measured by the EPA to determine compliance with the stated emission limit.The second standard is a ‘Work Practice’ approach, which tells you ‘What’ to do, ‘When’ to do it, and ‘How’ to do it. The last standard is ‘Equipment Modification/Standards’, which requires changes to components or component configurations.
 Figure 2: The cover page of the PVP Paper mentioned in the article.
So, what does this mean for a manufacturer? It means that the EPA heavily focused on fugitive emission reductions. The questions for manufacturers became, how can our product(s) best perform to each one of the three standards in place? And is M21 the best way to show how our product(s) function, or would bagging be a better way to show our product(s) performance? Based on the research, it was concluded that bagging is highly time-consuming, and M21 is the fastest approach when recording the maximum screening value, which has the best correlation coefficient to the emitted mass emission.
The ASME PVP paper published in 2017, titled “ASME B16.20 Spiral Wound Gaskets Performance Testing,” was authored by technical directors from Teadit (José Veiga and Joel Baulch) and Hex Technology (Scott Hamilton). This paper laid the foundation for the current ASME B16.20 Performance Test. The paper introduced a leakage criterion for spiral wound gaskets, aligning it with API 624, which specified a Methane concentration of 100 ppmv per EPA Method 21. This was done by converting this value into a leak rate per millimeter (or inch) of the gasket’s outer diameter, accounting for the varying gasket sizes. Consequently, a maximum allowable leakage rate was defined at 0.0137 mg/s·m (7.67E–10 lb/sec·in).
The paper also established the minimum seating stress for each pressure class and outlined the test protocols. A pivotal element of the testing method involved sealing the gasket’s winding outside diameter with an O-ring. This approach allowed for the comprehensive measurement of all leakage (global reading) rather than focusing solely on the maximum value (local reading). It closely resembled Radian Corporation’s approach to ‘bagging’ identified leaks.
The data collected in Teadit’s lab reveals an interesting trend when comparing the leakage results of the same gasket for both B16.20 and M21 tests. It shows that in 73% of the tests, the M21 readings indicated lower levels of leakage. However, a question arises: if B16.20 effectively contains all the leakage around the gasket, why does M21 not consistently show lower leakage in 100% of the cases? Various interferences can impact the measurements even in a controlled environment like a lab, with minimal leaks. As detailed in the ASME PVP Paper, when the gasket is not adequately contained, CH4 concentration can fluctuate and reach the inlet probe in intermittent bursts, resulting in unstable readings.
Development of Standards
Testing procedures have been developed using these types of methods. Given the discovery that valve stems constitute as the primary source of identified leaks within the Process Industry, the initial focus of development was on low-emission packing products. For valves and packing, some of the most notable are ISO 15848-1, API 622, API 624, and API 641. All of these have M21 monitoring requirements and a maximum allowable leakage, which can be observed for a pass or fail of the test. However, when it comes to gaskets, the situation becomes more complex. The 2012 edition of ASME B16.20 did not include standardized test protocols to ensure that Spiral Wound Gaskets also meet the performance criteria for Low Emissions.The ASME PVP paper published in 2017, titled “ASME B16.20 Spiral Wound Gaskets Performance Testing,” was authored by technical directors from Teadit (José Veiga and Joel Baulch) and Hex Technology (Scott Hamilton). This paper laid the foundation for the current ASME B16.20 Performance Test. The paper introduced a leakage criterion for spiral wound gaskets, aligning it with API 624, which specified a Methane concentration of 100 ppmv per EPA Method 21. This was done by converting this value into a leak rate per millimeter (or inch) of the gasket’s outer diameter, accounting for the varying gasket sizes. Consequently, a maximum allowable leakage rate was defined at 0.0137 mg/s·m (7.67E–10 lb/sec·in).
The paper also established the minimum seating stress for each pressure class and outlined the test protocols. A pivotal element of the testing method involved sealing the gasket’s winding outside diameter with an O-ring. This approach allowed for the comprehensive measurement of all leakage (global reading) rather than focusing solely on the maximum value (local reading). It closely resembled Radian Corporation’s approach to ‘bagging’ identified leaks.
Testing Capabilities
Teadit North America (TNA) has one of the most comprehensive in-house testing and data-gathering labs in the gasket industry. Not only limiting the test to 4-inch, 300-class spiral wound gaskets but also conducting tests on a wide range of sizes and pressure classes. Performance testing does not stop at adhering to the current version of ASME B16.20; it also includes the M21 after the 4-hour test of B16.20. In this approach, both tests are conducted on the same gasket. This allows end users to evaluate gasket performance according to B16.20 and provides insights into the likely readings when these gaskets are used in field operations.The data collected in Teadit’s lab reveals an interesting trend when comparing the leakage results of the same gasket for both B16.20 and M21 tests. It shows that in 73% of the tests, the M21 readings indicated lower levels of leakage. However, a question arises: if B16.20 effectively contains all the leakage around the gasket, why does M21 not consistently show lower leakage in 100% of the cases? Various interferences can impact the measurements even in a controlled environment like a lab, with minimal leaks. As detailed in the ASME PVP Paper, when the gasket is not adequately contained, CH4 concentration can fluctuate and reach the inlet probe in intermittent bursts, resulting in unstable readings.
Conclusion
The truth is there is no winner in the debate between Local (M21) versus Global Reading (B16.20). Instead, the synergy of both methods offers the optimal approach to reducing overall emissions and follows the original methodology used. M21 proves to be the better fit for field operations due to its practicality, time efficiency, and cost-effectiveness. However, combined use of both methods is recommended in a laboratory setting. The B16.20 bagging methodology excels in precision, capturing all leakage around the gasket, while the M21 anticipates the field readings, making them a powerful duo in emissions reduction strategies.Reference:
https://www.google.com/ url?sa=i&url=https%3A%2F%2Fwww.insider. com%2Fvintage-photos-los-angeles-smog-pollution-epa-2020-1&psig=AOvVaw3G4E5a5ikau369THPYtxhO &ust=1701336973984000&source=images&cd=vfe&o pi=89978449&ved=0CBIQjRxqFwoTCJiojqL06IIDFQAA AAAdAAAAABAE About the Author
Bronson Pate is currently the Environmental Consulting Manager for Teadit North America. He has more than 15 years of experience dealing with regulatory and technical issues related to Leak Detection and Repair (LDAR) for numerous industries both here and abroad, specifically within refining, petrochemical and chemical industry plants. As one of the world’s leading experts on equipment leak fugitive emission source monitoring, tagging, and LDAR database management he has participated and/or lead 375 audits at multiple facilities on U.S.EPA LDAR Consent Decree (CD) requirements. In addition to being able to provide all levels of training for EPA Method 21 monitoring and other LDAR related Technician trainings, he also has experience dealing with air quality compliance and permitting issues for refining, petrochemical, and natural gas processing industries.
 About the Expert
Fabio Fujii is the current Quality Assurance Manager at Teadit North America in Pasadena, Texas. A degreed mechanical engineer with a dynamic career spanning twelve years within the Teadit Group, Fabio’s primary expertise lies in the design of expansion joints. He recently transitioned to the Quality Department, bringing a wealth of experience to the position and team.